Population and Sample
When you start studying statistics, one of the first concepts you will encounter, much like “sets” in high school math, is the concept of population and sample.
Although it may not be the most exciting topic, understanding population and sample is essential to grasp statistics for hypothesis testing.
This content is so important that I will mention it again. To understand statistics for hypothesis testing, it is crucial to thoroughly understand the process of sampling from a population and creating a sample!
In this article, we will imagine a hypothetical population of “150 aliens living on Venus”, extract a sample, and calculate sample statistics to understand population and sample.
Population and Parameters
A population refers to the entire set of interest from which we want to obtain information.
The concept of a population is actually abstract and unknown, but let’s create an imaginary population in this article.
Let’s say there are exactly 150 aliens living on Venus, and according to the divine revelation, the height of each alien follows the following distribution.
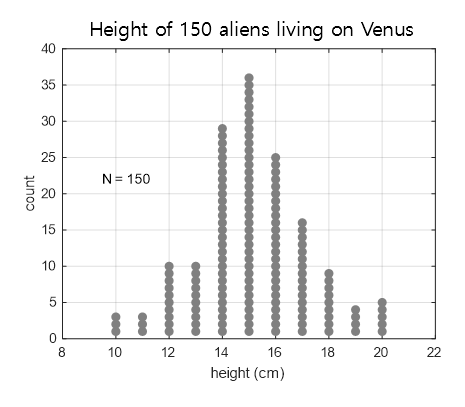
Figure 1. Distribution of heights of the imaginary population of 150 aliens on Venus
The distribution of a group can be described mathematically even if we do not know all the data of the entire population. Among the well-known distributions, the most famous one is the normal distribution, which can be characterized by its mean and standard deviation.
With these characteristic values of the entire population, we can statistically infer the characteristics of the population “approximately”.
These characteristic values are called “parameters”, and some of the representative parameters are as follows:
- Mean
- Variance, standard deviation
- Quantiles (median, quartiles, etc.)
- Population proportion
- In other words, since we cannot obtain data for the entire population, we want to estimate the characteristics of the population by identifying the parameters that represent the characteristics of the population1.
The problem may seem to have become simpler, but how can we estimate the parameters well?
Sample Population and Sample Statistics
In statistics, a sample can be thought of as a subset of the population.
For example, let’s say we randomly sample 6 individuals from the 150 individuals in Figure 1 (population) that we saw earlier. The result could be as shown in Figure 2.
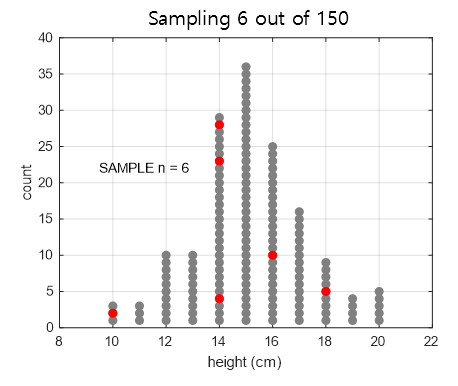
Figure 2. Sampling 6 individuals from a population of 150 individuals. (Samples are shown in red)
Sampling is done for practical reasons, as it would be too expensive to examine the entire population.
Therefore, samples can be considered as obtained for the purpose of estimating parameters.
However, when sampling, assuming that the samples are randomly selected, could the samples be composed of different values each time they are drawn? If we sample a group of 6 individuals three times, the result would be as shown in Figure 3.
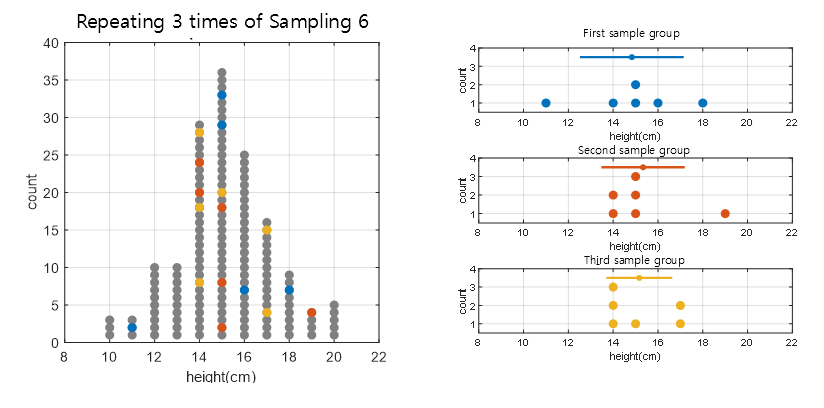
Figure 3. Drawing samples three times and plotting the sample distribution obtained each time
As can be seen in Figure 3, samples have the characteristic of having different values each time they are drawn.
In addition, in order to describe the sampled data statistically, it would be convenient to have numerical values that represent statistical features. Similar to parameters, sample statistics (statistics) that represent the characteristics of the distribution can be calculated from the samples.
Some representative sample statistics include:
- Sample mean
- Sample standard deviation
- Sample proportion
However, the value of the sample statistic also changes every time a sample is drawn, so wouldn’t the sample statistic also change each time?
That’s correct. The sample statistic can be considered as an ‘estimate’ of the population parameter, and the estimated value always comes with an error.
Estimation involves error: Standard Error(☆)
The term “Standard Error”2 refers to the “standard deviation of the sample statistic”.
(You need to read the article carefully. The wording gets twisted.)
As mentioned earlier, due to the characteristic of samples changing every time they are drawn, sample statistics have variability (or error) in their values.
In Figure 4 below, we created a process of drawing a sample of size n=6 100 times and calculating the sample mean each time.
Figure 4. Sample means obtained from 100 repeated samples
In other words, as can be seen from Figure 4, the samples have different values for each composition when they are drawn, and the values of the sample statistics also change each time.
Derivation of the Formula for Standard Error of Sample Mean
Let’s calculate the standard deviation of the sample mean, which is the standard error of the mean (SEM), as seen in Figure 4.
When conducting an experiment where n samples are drawn at once, the sample mean can be calculated as follows:
\[\bar{X} = \frac{1}{n}\sum_{i=1}^nX_i\]Here, $X_i$ represents the sample values from a single sample drawn.
We are interested in the standard deviation of this sample mean ($\bar{X}$), so let’s first calculate the variance of the sample mean, which is as follows:
\[Var[\bar{X}] = Var\left[\frac{1}{n}\sum_{i=1}^nX_i\right] = Var\left[\frac{1}{n}\left(X_1+X_2+\cdots+X_n\right)\right]\]Based on the two properties of variance operators as shown in (3) and (4), the equation (2) can be written as follows:
\[Equation(2) = \frac{1}{n^2}Var\left[X_1+X_2+\cdots+X_n\right]\] \[=\frac{1}{n^2} \times n\times Var[X] = \frac{1}{n}Var[X]\]In other words, if we denote the population variance as $\sigma^2$, the standard deviation of the sample mean is given by
\[\sqrt{Var[\bar{X}]} = \frac{1}{\sqrt{n}}std[X] = \frac{1}{\sqrt{n}}\sigma\]When the estimate of the population variance is denoted as $s^2$, the standard deviation of the sample mean can be written as
\[SEM = \sqrt{Var[\bar{X}]} = \frac{s}{\sqrt{n}}\]The last scene of Figure 4 is shown in Figure 5, where it can be observed that the width of the distribution of sample means on the right is smaller compared to the original distribution on the left.
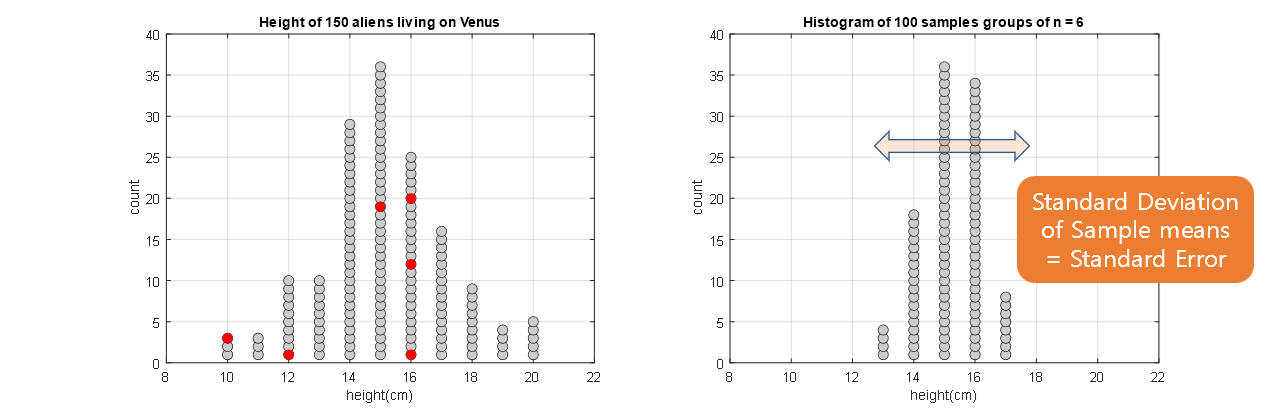
Figure 5. Sample means up to the 100th sample.
Note: Standard error and standard deviation are different concepts.
There are cases where standard error of the sample mean (SEM) and standard deviation are mixed up or used incorrectly, especially when reading research papers. As seen in equation (8), SEM is always smaller in value compared to the standard deviation, which makes the results appear better when describing the data.
To summarize, standard deviation describes how spread out the distribution of the population is, while SEM quantifies the uncertainty of the estimate of the mean. In most cases, when presenting data, it is important to use standard deviation (or its estimate) to describe the data, as readers are usually more interested in the population characteristics.
Reference
- Primer of biostatistics 6th edition, Stanton A Glantz, McGraw-Hill Medical Publishing Division