
A comic that humorously depicts the problems with hypothesis testing using p-values
The p-value is one of the essential tools in scientific research based on statistics for determining the significance of research results. However, many researchers misuse p-values or intentionally manipulate research results by exploiting the characteristics of p-values.
In this article, we will discuss the meaning of p-values and some common misuses of p-values.
The Meaning of p-values
Let’s start by understanding the mathematical meaning of p-values, although it may seem a bit technical. Then, we will try to explain the concept of p-values in a simpler way.
For example, let’s say we want to test if there is a statistically significant difference in the means of two sample groups. In this case, we can calculate a test statistic (e.g., t-value) from the two sample groups.
The p-value is the probability associated with this test statistic, and it represents the probability of obtaining a test statistic that is greater than or equal to the one we obtained from our data.
One crucial point to note is that the test statistics we calculate are mostly obtained assuming the null hypothesis. In other words, they assume that the populations from which the two sample groups come from are the same.
Therefore, in simpler terms, we can say that the p-value roughly means:
"Let's assume that the two sample groups in our data come from the same population.
Then, how plausible is it to obtain this test statistic (e.g., t-value)?"
The Convenience of p-values
People like convenience. Not only in daily life but also in the field of research, everyone prefers explaining research results in a simple and concise manner rather than complicating them.
Let’s say we have a study that compares the differences between two sample groups. There are various ways to describe the results of this comparison.
One way could be to list all the data values, or we could plot histograms of the two datasets to visually show the differences. However, these methods have limitations in terms of rigor and precision.
That’s why the concept of test statistics came into existence to ensure rigor.
How did we calculate the test statistic, such as the t-value? As a math blogger, I would translate the sentences as follows:
“Upon further reflection, it can be seen that there is a significant rationale. The t-value explains both the difference between sample group means and the uncertainty of this difference by dividing it, providing a simultaneous explanation of the difference between groups and how certain this difference is.
As a result, by presenting only the test statistic, it has become possible to express the difference between sample groups in a rigorous and convenient manner.
However, there was another issue. Since the t-distribution varies depending on the sample size (i.e., degrees of freedom), even if the same t-value is used, it can be said that the difference between samples is sufficiently large or not, depending on the sample size.
When considering this process, it can be understood why ‘probability’ indicators such as p-value were used to check for significance. By specifying only one value, probability, regardless of the sample size or shape of the distribution of the test statistic, there is no reason to be confused.
Since probability is a normalized value, it is easy to grasp the significance of experimental results at a glance with just one threshold. Usually, a 5% threshold is commonly used. Therefore, if the p-value is less than 5%, it is said that there is a significant difference.
The Backfire Effect of Convenience
The p-value further compresses the information that the test statistic already contained.
In other words, the p-value contains information about both the effect size and the sample size at once.
Therefore, it can be observed that even if only one of the effect size or sample size changes, the p-value becomes smaller as if guaranteeing a significant difference.
- Effect size
- e.g., Difference between sample means
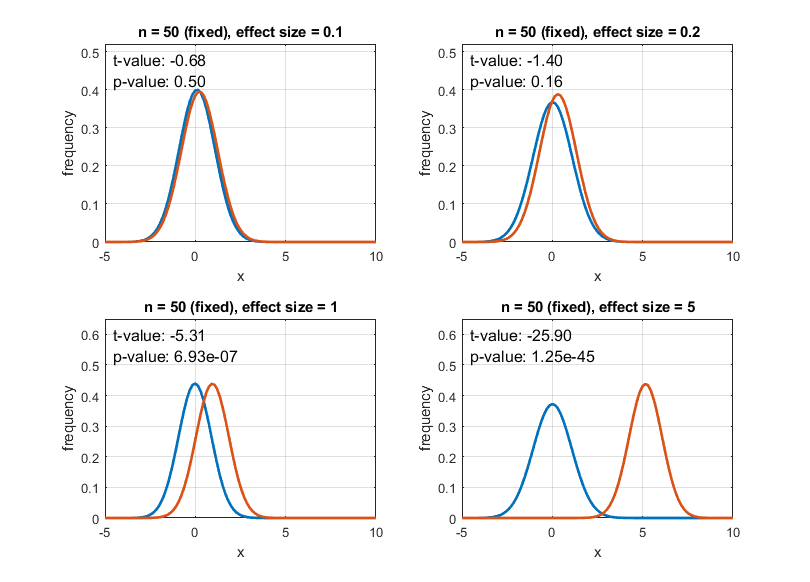
Figure 1. The change in p-value as the effect size changes for the same sample size.
- Sample size
- e.g., Sample size in t-value includes concepts of uncertainty and degrees of freedom.
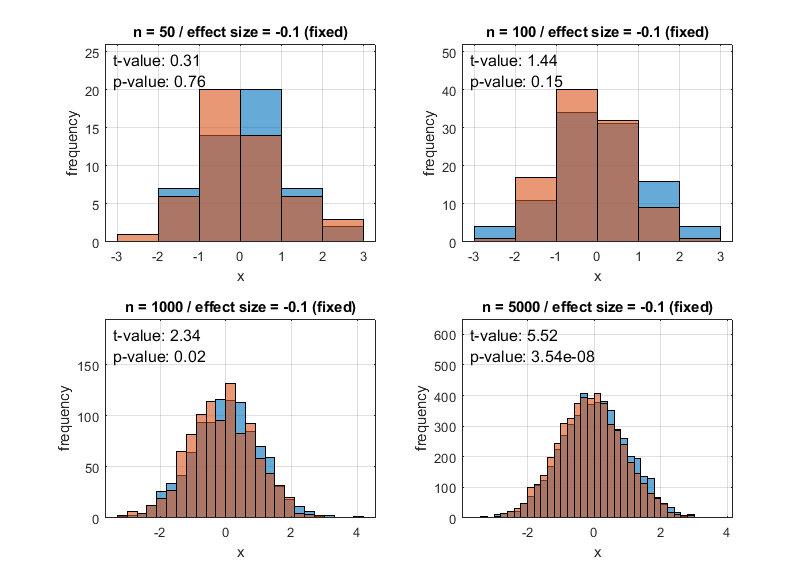
Figure 2. The change in p-value as the sample size changes for the same effect size.
”
When looking at Figures 1 and 2, it can be observed that not only does the p-value decrease as the effect size changes, but also the p-value decreases as the sample size (n) increases.
In other words, even if two sample groups are significantly different in a single population, the p-value can be lower than 0.05, and even if the null hypothesis is rejected and the alternative hypothesis is accepted, the alternative hypothesis may still not be true.
Recently, with the advancement of science and technology, there has been an increase in research that easily obtains data with large sample sizes. Therefore, it is important to be cautious and not blindly rely on p-values during the statistical validation step, especially in such studies.
References:
- Primer of Biostatistics 6th Edition, Stanton A Glantz, McGraw-Hill Medical Publishing Division.