Prerequisites
To fully understand this post, it is recommended to be familiar with the following content:
Methods for comparing multiple sample groups
When conducting research or surveys, it is often necessary to compare the means of multiple sample groups.
For example, suppose we conduct a survey to determine how two types of food, A and B, affect body weight.
To answer this question, we can conduct a study as follows:
First, we recruit a group of subjects with little difference in body weight and divide them into three groups: one control group and two groups that will consume only food A or B, respectively. We then regulate their diets accordingly.
To determine if there is a difference in body weight between the three groups, we need an appropriate measure of “group difference.”
Assuming little difference in body weight among the subjects, we can consider the multiple sample groups as samples extracted from a single population.
Suppose that after the subjects in the three groups eat their respective foods and a suitable amount of time has passed, their weight measurements follow the distribution shown in Figure 1.
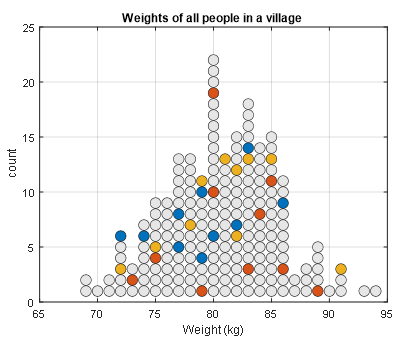
Figure 1. Three groups extracted from a single population. Each circle represents a person, and the different colors represent different sample groups.
From Figure 1, we can see that food A and B do not have a significant effect on body weight.
However, in the actual research process, we can only examine the distributions of the sample groups, not the entire population.
If we display each sample group separately, as shown in Figure 2, we can see that the sample means of each group appear to differ, especially in the lower subplot of Figure 2.
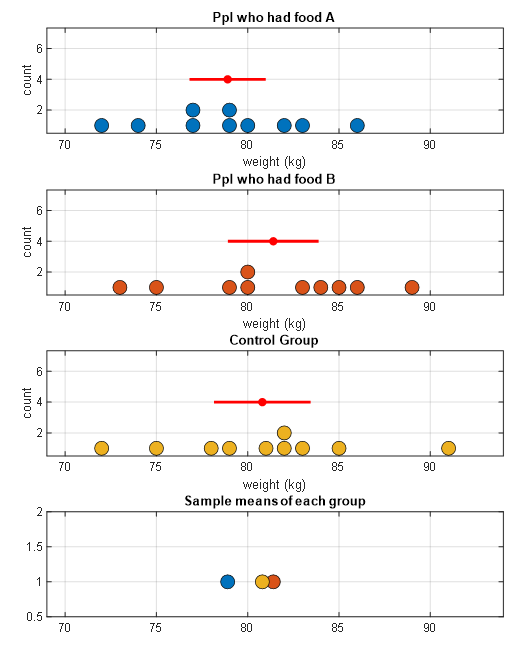
Figure 2. Sample groups displayed separately for food A, B, and the control group. The red dots and lines represent the means and standard deviations of each sample group.
From Figure 2 alone, it appears that there are mean differences among the sample groups. However, when we consider the results from both Figures 1 and 2, we can ask the following question:
Is this difference due to the effect of the food, or is it due to other reasons (random fluctuations in body weight)? (☆)
Meaning of F-value: Difference/Uncertainty
F-value is a statistic used to compare multiple sample groups, and in conclusion, F-value has almost the same meaning as the t-value learned earlier.
In other words, similar to the meaning of t-value, F-value also describes the difference/uncertainty between sample groups with a single number.
Statistical indicator of differences among multiple sample groups: Degree of difference/Uncertainty between groups
The difference between F-value and t-value is that F-value uses a slightly modified version of the degree of difference and uncertainty between groups. F-value uses the ratio of variances calculated from these groups1.
Logical derivation of F-value
Calculation of between-group variance and within-group variance
Now let’s examine the differences among three groups. As mentioned earlier, variance is used for this purpose.
Returning to the question (☆), both the influence of food and random fluctuations in body weight can be explained by the concept of “variance”.
The variance used to determine if the influence of food was significant can be calculated by how much the means of each sample group deviate from each other.
As seen in the article on meaning of sample and standard error, each group can be thought of as a sample extracted from the population.
In other words, the standard deviation of the group means of the sample groups, or the standard error, can be considered as the standard deviation of the sample means.
In mathematical notation, the standard error can be written as follows, assuming that the sample size of each sample group is denoted by $n$:
\[\sigma_{\bar{X}}=\frac{\sigma}{\sqrt{n}}\]Therefore, the between-group variance of the sample groups can be written as follows:
\[\sigma^2_{bet} = n \sigma_{\bar{X}}^2\]Here, we do not know the population variance and use the sample variance, so we can replace $\sigma$ with $s$ as follows:
\[s^2_{bet} = n s_{\bar{X}}^2\]On the other hand, random fluctuations in body weight due to reasons other than food can be estimated as within-group variance, which can be calculated by taking the arithmetic mean of the variance values obtained from the three groups2.
\[s^2_{wit} = \frac{1}{3}(s^2_A + s^2_B + s^2_{con})\]Calculation of the ratio of two variances
We calculated two variances, which is essentially estimating the population variances in two different ways.
And we want to divide the two variances calculated according to the logic mentioned in the sentence below.
Statistical measure of differences between multiple samples: Degree of differences between groups / Uncertainty
In other words, the F-value can be calculated as the ratio of the two variances shown in the figure below.
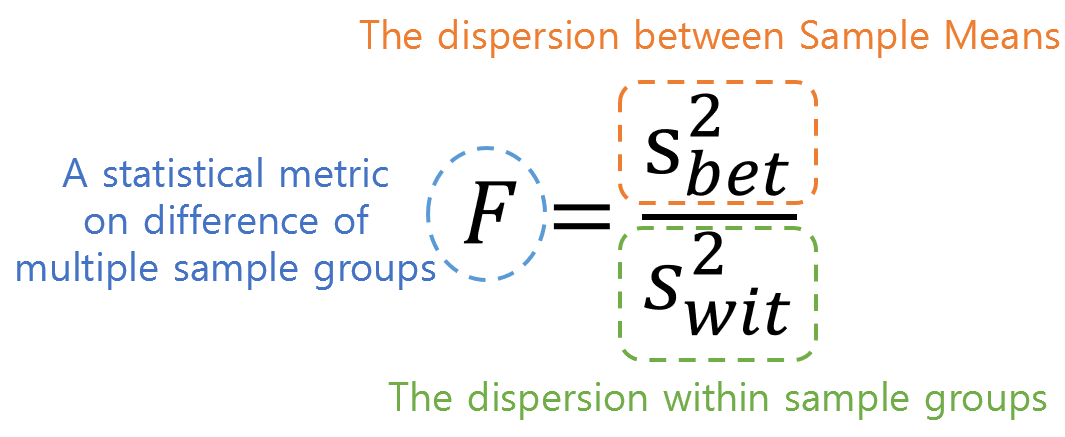
Figure 3. Meaning of the numerator and denominator of F value
Therefore, if the difference between sample groups shown in Figure 2 is due to random reasons, the ratio of the two estimated population variances should be close to 1, as they are estimating the same population variance using different methods.
On the other hand, if this value is considerably greater than 1, it means that the variability between sample means is larger than the variability estimated using variability within samples. This implies that not all sample groups may have come from the same population.
Example problem for calculating F-value
※ The problem is taken from Primer of Biostatistics, Glantz (2011).
Let’s try to calculate the F-value for the problem of decreased sperm motility in males due to cellphone use.
We want to calculate the F-value for two groups, one with low cellphone usage and the other with high cellphone usage. (Both groups have 61 participants each.)
As shown in the figure below, the researchers measured the percentage of rapidly moving sperm, which was found to be 49% on average in the group with low cellphone usage and 41% in the group with high cellphone usage, with standard deviations of 21% and 22% respectively.
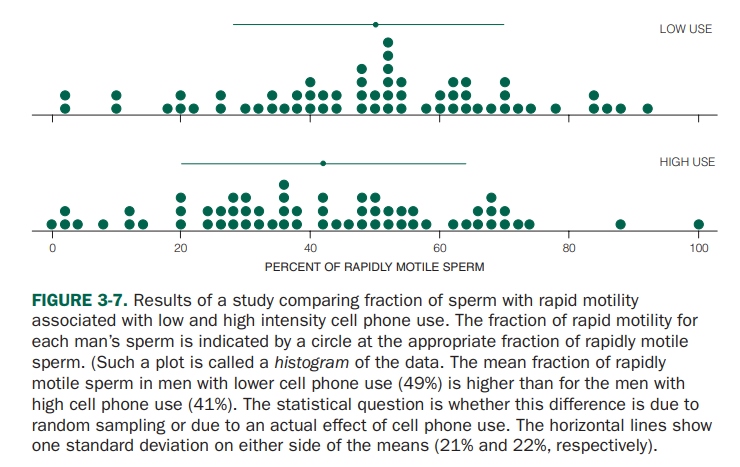
Figure source: Primer of Biostatistics, Glantz (2011)
Let’s try to express the difference between the two groups using the F-value.
First, let’s calculate the within-group variance.
\[s^2_{wit} = \frac{1}{2}\left(s^2_{low}+s^2_{high}\right)\] \[=\frac{1}{2}\left(21^2+22^2\right) = 462.5\%\]Next, let’s calculate the between-group variance. In order to calculate the between-group variance, we need to be able to calculate the value of the standard error.
Here, the standard error represents how much the average of each group deviates from the overall average, which can be seen as how spread out the averages of each group are from the overall mean.
Therefore, the overall mean of the data is
\[\bar{X} = \frac{1}{2}\left(\bar{X}_{low}+\bar{X}_{high}\right)\] \[=\frac{1}{2}(49+41) = 45\%\]So, the value of $s_{\bar{X}}$ is
\[s_{\bar{X}}=\sqrt{\frac{(\bar{X}_{low}-\bar{X})^2+(\bar{X}_{high}-\bar{X})^2}{m-1}}\] \[=\sqrt{\frac{(49-45)^2+(41-45)^2}{2-1}}=5.66\%\]Here, the sample size of each group is $n=61$, so
\[s^2_{bet}=ns^2_{\bar{X}}=61(5.66^2)=1952\%\]Therefore, the F-value can be calculated as follows:
\[F=\frac{s^2_{bet}}{s^2_{wit}}=\frac{1952}{462.5}=4.22\]The Meaning of F-distribution and a Large F-value
Analysis of Variance (ANOVA) verifies whether the calculated F-value, obtained through the above process, is significantly large to determine if at least one of the sample groups came from a different population.
Then, how can we know if the F-value is large enough?
As mentioned in the section “Test Statistic” in the article on meaning of t-value and Student’s t-test, the F-value, which is one of the test statistics, is a second-order processed version of the sample statistics.
Similar to the calculation of the distribution of sample means in the article on the meaning of sample and standard error, we can randomly select three3 sample groups from the population and calculate the F-value. Let’s repeat this process 100 times while the population size is 150 and the sample size is 10, and examine the distribution of the F-values.
Figure 4. Plot of F-values obtained from extracting three sample groups of n=10 from a population 100 times
Upon careful observation of the process in Figure 4, it can be noticed that occasionally, even when calculating F-values from three sample groups extracted from a single population, F-values with high values of 3 or more can be obtained, despite being calculated from a single population.
In other words, the fact that sufficiently large F-values are obtained from the sample groups indicates the following:
The probability of obtaining such large F-values when assuming that the sample groups come from a single population is very low, so it can be said that the probability of the sample groups coming from a single population is also very low.
In fact, the sampling process as shown in Figure 4 can have almost an infinite number of possibilities, not just 100 times. For example, when the population size is 150 and three sample groups of n=10 are drawn, the number of possible cases is:
\[_{150}C_{30} = 32,198,785,340,494,567,031,466,236,484,400\notag\]Such a large number of possibilities makes it impossible to perform sample extraction for all cases. Therefore, the distribution of F-values is mathematically calculated and formulated as the F-distribution (solid line on the right side of Figure 4).
Finally, sufficiently large F-values are usually determined based on values such as the upper 5% or 1% in general, and the last scene in Figure 4 can be confirmed by referring to Figure 5. The F-value obtained from the simulation for the upper 5% is not significantly different from the actual upper 5% F-value (3.35) on the F-distribution.
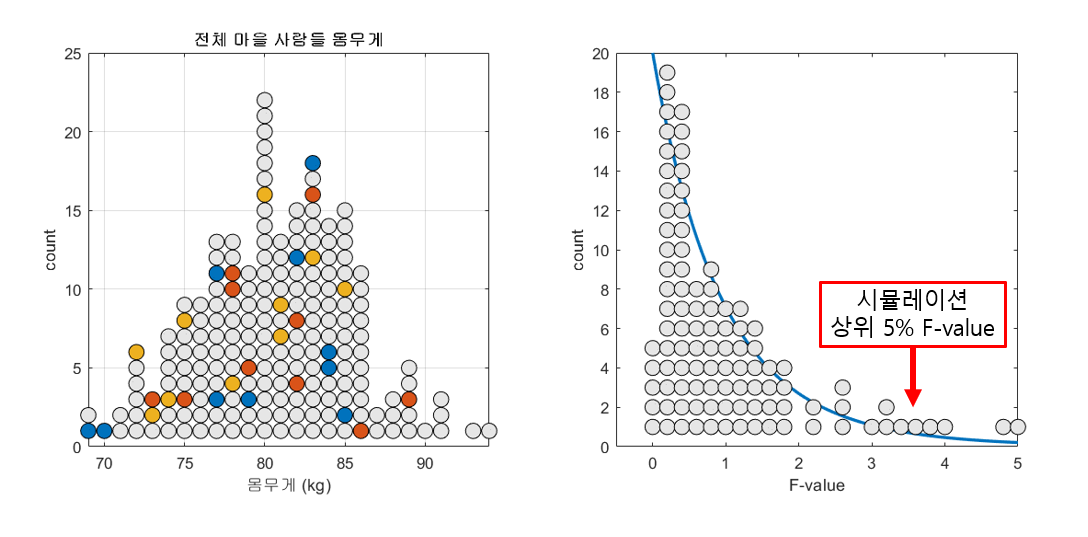
Figure 5. Result of simulating 100 calculations of F-values and obtaining the upper 5% F-value
Proof of equivalence between t-value and F-value: F = t^2
As we have emphasized throughout the two articles, t-values and F-values carry essentially the same meaning.
In this section, we mathematically verify that $F=t^2$.
Let’s consider two sample groups with sample size of $n$, and let the sample means and standard deviations of each group be $\bar{X}_1$, $\bar{X}_2$, $s_1$, and $s_2$, respectively.
First, we can calculate $s^2_{wit}$ used in the F-value as follows.
\[s_{wit}^2=\frac{1}{2}(s_1^2+s_2^2)\]Furthermore, the following process can be used to calculate $s^2_{bet}$ used in F-value:
\[s_{\bar{X}} = \sqrt{\frac{(\bar{X}_1-\bar{X})^2+(\bar{X}_2-\bar{X})^2}{2-1}}\] \[\therefore s_{\bar{X}}^2=(\bar{X}_1-\bar{X})^2+(\bar{X}_2-\bar{X})^2\]Here,
\[\bar{X} = \frac{1}{2}(\bar{X}_1+\bar{X}_2)\]Thus,
\[Equation (15) = \left[\bar{X}_1-\frac{1}{2}(\bar{X}_1+\bar{X}_2)\right]^2 + \left[\bar{X}_2-\frac{1}{2}(\bar{X}_1+\bar{X}_2)\right]^2\] \[=\left(\frac{1}{2}\bar{X}_1 - \frac{1}{2}\bar{X}_2\right)^2+\left(\frac{1}{2}\bar{X}_2 - \frac{1}{2}\bar{X}_1\right)^2\]Squaring real numbers always results in positive values, so the two terms in Equation (18) are equal. Therefore,
\[Equation (18) = 2\left(\frac{1}{2}\bar{X}_1 - \frac{1}{2}\bar{X}_2\right)^2\] \[=\frac{1}{2}\left(\bar{X}_1 - \bar{X}_2\right)^2\]Hence, $s^2_{bet}$ is as follows:
\[s^2_{bet} = ns_{\bar{X}}^2=(n/2)\left(\bar{X}_1-\bar{X}_2\right)^2\]Therefore, according to the definition of F-value discussed in this article,
\[F=\frac{s^2_{bet}}{s^2_{wit}}=\frac{(n/2)(\bar{X}_1-\bar{X}_2)^2}{(1/2) (s_1^2+s_2^2)}\] \[=\frac{(\bar{X}_1-\bar{X}_2)^2}{(s_1^2/n)+(s_2^2/n)}\] \[=\left[\frac{\bar{X}_1-\bar{X}_2}{\sqrt{(s_1^2/n)+(s_2^2/n)}}\right]^2\]The value inside the parentheses in Equation (24) is the same as the t-value. Therefore,
\[F=t^2\]Reference
- Primer of biostatistics 6th edition, Stanton A Glantz, McGraw-Hill Medical Publishing Division
-
Why do we need to transform variance again? It’s because there are more than two groups. How can we express the difference among three groups with a single number? The answer is variance (or standard deviation). ↩
-
In this article, the sample sizes of the three sample groups are assumed to be the same, so arithmetic mean can be used for calculation. However, if the sample sizes of the sample groups are different, pooled variance can be used. ↩
-
Or more than three ↩