What statistical technique can be used when comparing before/after data of a group?
This post was written with reference to Primer of Biostatistics, 7th edition by S. Glantz.
Prerequisites
To better understand this post, it is recommended to know the following topics:
Motivation
In a previous post, Meaning of t-value and Student’s t-test, we introduced the t-test as one of the statistical techniques for comparing two sample groups. The t-test we introduced is also called the independent sample t-test, because it compares two sample groups that are independently drawn.
However, in some experiments, there may be a need to compare before/after data of the same subject. For example, experiments on the effectiveness of diet pills or smoking cessation may require this. If it is possible to statistically compare before/after data of the same subject, it would be possible to verify the effects of treatment more sensitively by confirming the effects for each individual.
In this post, we introduce the paired t-test as a parametric statistical technique that allows for the statistical comparison of before/after data of the same subjects.
Explanation of paired t-test
In the Motivation section, we mentioned that if it is possible to compare before/after data of the same subject for a given treatment, it would be more effective in verifying the effect of the treatment. Let’s take a closer look at what this means with an example illustrated in Figure 1, which shows the results of an experiment to verify the effect of a diuretic drug (a drug that increases urine output).
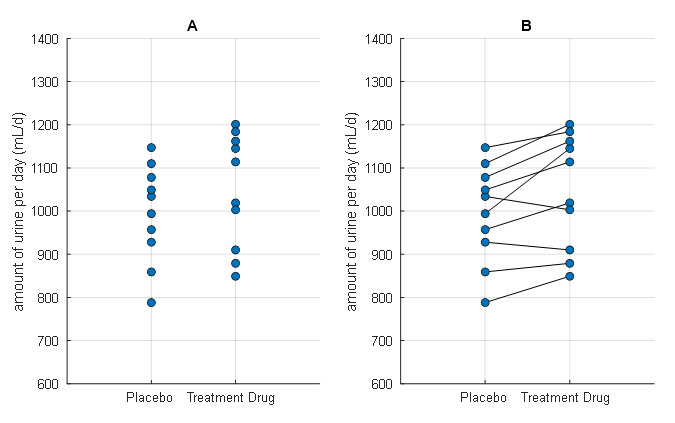
Figure 1. Results of an experiment to observe the treatment effect of a diuretic drug
This figure was created with reference to Figure 9-1 in Primer of biostatistics, 7th ed., by S. Glantz.
If you look at Figure 1, you can easily see the difference between the left (A) picture and the right (B) picture. The difference is whether the line is crossed out or not. The left (A) picture assumes that the placebo and drug groups are randomly sampled groups that are independent of each other. In contrast, the right (B) picture assumes that the experiment was conducted by administering a placebo and a drug to the same group of subjects.
Interpretation with independent sample t-test
Let’s conduct a t-test in the situation of the left (A) in Figure 1.
The means of the two groups are 994.4 and 1046.6, respectively. The standard deviations of each group are 113.0046 and 132.7983, respectively. If we calculate the t-value, it is as follows1:
\[t=\frac{\bar{X}_1 - \bar{X}_2}{\sqrt{s_1^2/{n_1^2} + s_2^2/{n_2^2}}}=-0.9467\]Here, both $n_1$ and $n_2$ are 10.
The degree of freedom is $n_1+n_2-2=18$. If we conduct a two-tailed t-test, the criterion for a significant t-value is $t_{0.05}=-2.101$. Therefore, we can say that the t-value given to us, -0.9467, is far from reaching -2.101. In other words, if statistical analysis is conducted in this way, we can only conclude that this medicine does not work as a diuretic.
Interpretation with paired sample t-test
However, let’s carefully look at the right(B) situation in Figure 1 to see what the experimental results look like. We can see that only 2 of the 10 subjects decreased urine output after taking the medicine, while 8 subjects had increased urine output. In terms of the individual effect of treatment that was applied, we can conclude that this medicine clearly works as a diuretic.
Therefore, let’s make a statistic about the difference before and after, which can be seen in the right (B) of Figure 1.
As mentioned in the meaning of t-value and Student’s t-test, the fundamental meaning of t-value is “difference / uncertainty”. In brief, we explained that since the sample mean always involves errors, a measure of the difference in mean values should be made while considering the error that occurs. Therefore, we can also think of the t-value as follows.
\[\text{(paired test) }t = \frac{\text{mean difference}}{\text{standard error of the mean difference}}\]The mean difference can be denoted as $\bar{d}$ from the meaning of difference, and we can express the t-value as follows.
\[t=\frac{\bar{d}}{s_{\bar{d}}}\]Here, the standard error for $\bar{d}$ is $s_{\bar{d}}=s_d/\sqrt{n}$.
If we think about it, both the independent t-test and the paired sample t-test divide the difference into uncertainty in the same logic.
Let’s solve the problem by considering the paired t-test.
The following are the daily urine volumes for the placebo and medication groups:
\[\text{Placebo}=[788, 859, 928, 957, 994, 1034, 1049, 1078, 1110, 1147]\] \[\text{Medication}=[849, 879, 910, 1019, 1145, 1003, 1114, 1162, 1201, 1184]\]Therefore, the difference between placebo and medication is as follows:
\[d = \text{Placebo}-\text{Medication}=[-61, -20, 18, -62, -151, 31, -65, -84, -91, -37]\]Thus, $\bar{d}$ is the mean of $d$, which is:
\[\bar{d}=-52.2\]$s_{\bar{d}}$ can be calculated as $s_{\bar{d}}=s_d/\sqrt{n}$, where $s_d$ is the standard deviation of $d$, hence:
\[s_{\bar{d}}=\frac{s_d}{\sqrt{n}}=\frac{53.4723}{\sqrt{10}}=16.9094\]Therefore, the t-value is:
\[\text{(paired test) }t=\frac{-52.2}{16.9094}=-3.0870\]This value is smaller than the criterion t-value for a significant difference, $t_{0.05}=-2.2622$ (df=9, two-tailed), so we can conclude that there is a significant difference in urine output between the placebo and medication conditions.
Reference
- Primer of biostatistics, 7th ed., S. Glantz / Ch. 9 Experiments when each subject receives more than one treatment
-
Refer to the meaning of t-value and Student’s t-test for the method of calculating t-value. ↩